Week 6: the CMACXIMUS portfolio takes the $2.75M Millionaire with 210.50
A 17-lineup build with a heavy core, an overweight on the top chalk and a full fade of the Panthers defense.

- The CMACXIMUS portfolio won the $2.75M Millionaire with 210.50, from 17 lineups, among 158,904 entries.
- Panthers DST was on 31.8% of field rosters and in 0 of 17 lineups of the winning portfolio. It scored 4.00, so leaving it out was worth +3.11 per lineup.
- The biggest gain came from Kenneth Walker III: 14 of 17 lineups against a field at 23.3%, worth +10.11 per lineup.
- Of the +27.09 edge total, +22.01 came from lineups that did not win. That suggests an edge spread across the portfolio, not one lucky ticket.
The result
The CMACXIMUS portfolio won the $2.75M Millionaire on Sunday, Oct 18. Its best lineup scored 210.50 and took $1,000,000 against 158,904 entries. Nobody shared the top spot: 1 lineup, 1 user.
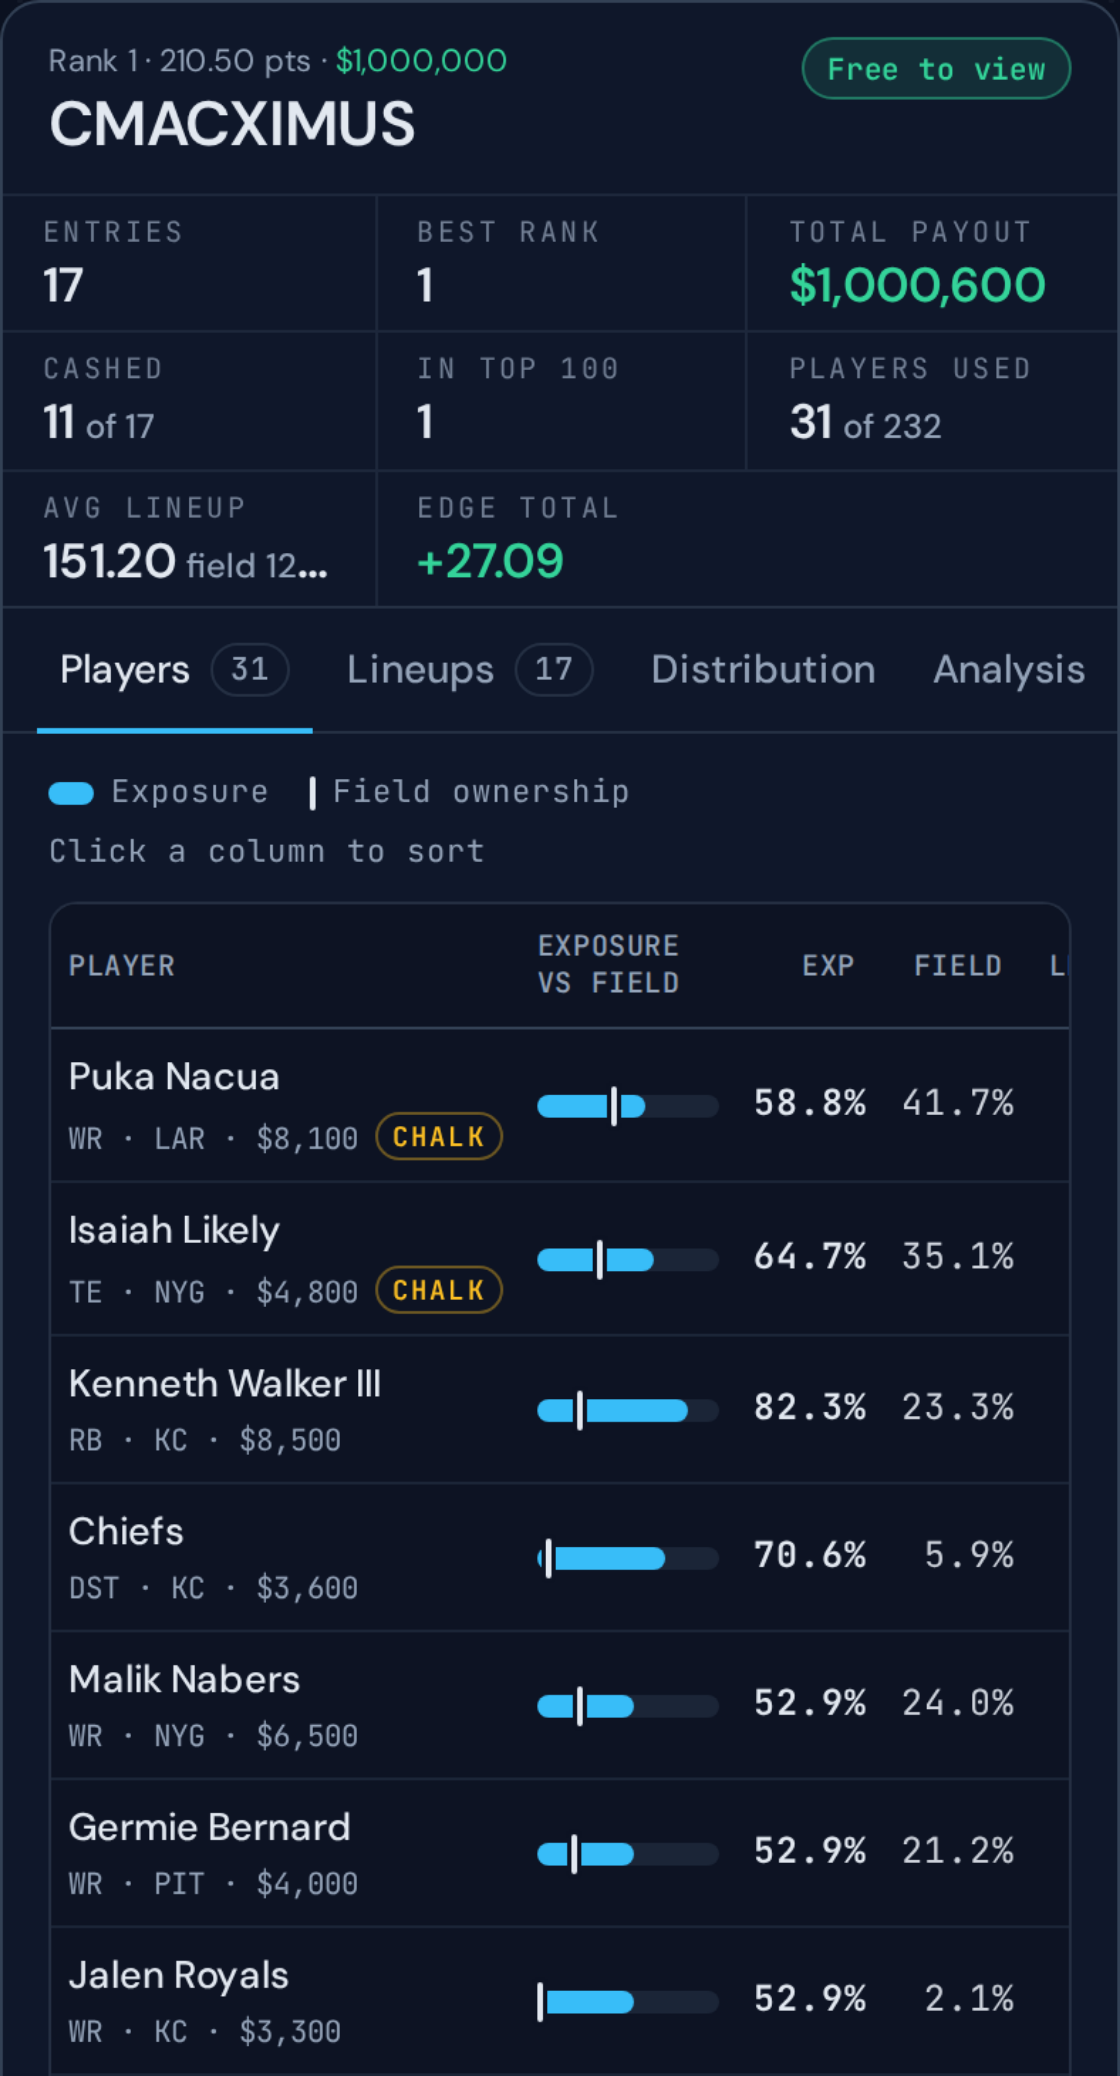
The portfolio entered 17 lineups, cashed 11 and collected $1,000,600. It used 31 players, 13.4% of the 232 the field used. That player count points to a concentrated build, even for a full portfolio.
One lineup won the contest. The portfolio's average lineup scored 151.20; the field's average lineup scored 124.09. The edge total, +27.09 points per lineup gained against the field, comes close to that gap. The other 16 lineups averaged 147.49 and supplied +22.01 of it. The winning lineup supplied +5.08.
That split suggests an edge spread across the portfolio, not one ticket carrying everything. A 210.50 lineup is still one outcome of many.
Pro view
The chalk
The most-owned player was Puka Nacua, at 41.7%. The winning portfolio held him in 10 of 17 lineups, over the field. He scored 14.00, and the overweight was worth +0.04 per lineup. A wash.
Next came Isaiah Likely at 35.1%. The portfolio was over the field again, with 11 of 17 lineups. He scored 23.90, worth +2.99 per lineup.
Panthers DST, at 31.8%, got a full fade: 0 of 17 lineups. The unit scored 4.00. Leaving it out was worth +3.11 per lineup, the biggest number among the chalk calls.
In its place sat Chiefs, in 12 of 17 lineups at 5.9% field ownership. That reads like a pivot at the position, worth +0.78 per lineup. The lineups show the swap. They cannot say why.
The edge
The biggest gain came from Kenneth Walker III: 14 of 17 lineups against a field at 23.3%. He scored 30.90, worth +10.11 per lineup.
Malik Nabers followed at 52.9% against 24.0%, scoring 31.50 for +5.12. Germie Bernard sat at 52.9% against 21.2%, scoring 25.70 for +3.79.
The top gains and the winning lineup's best scores come from the same players: Malik Nabers (31.50, over the field) and Kenneth Walker III (30.90, over the field). That points to the heaviest leans landing in the ticket that won. It could still be variance.
The biggest fade outside the chalk was Brock Bowers, at 19.5%, in none of the lineups. He scored 11.00, so the fade gained +0.54 per lineup. Not every lean paid: Jalen Royals, in 9 of 17 lineups, is the largest drag in the tables below.
The build
The portfolio ran 7 core plays, a heavy core. Kenneth Walker III led in 14 of 17 lineups, ahead of Chiefs in 12 of 17 lineups.
The QB had at least one teammate in 14 lineups, 82.4% of the portfolio, across 5 QB teams. Stacks on NYG led at 35.3%. Bring-backs appeared in some lineups: 23.5%. That reads like many stacks, not one game script.
The winning lineup broke from that shape: QB + 0 ATL + 1 bring-back, a naked quarterback with an opponent beside him. The QB was its lowest-owned seat at 4.9% and scored 24.10. The lineup spent $50,000, carried 164.0% total ownership and held 1 chalk seat.
Near the top
Of the 10 users in the top 10, 0 entered a single lineup. Every portfolio near the top was multi-entry.
On Puka Nacua, 7 users were under the field, 3 of them in none of their lineups. On Panthers, 7 were under and 5 left the unit out entirely. On Isaiah Likely, 1 went under and 0 left him out.
The winning portfolio's edge total ranked 5th among those users, in the upper half. The highest, +52.47, came from a 4-entry portfolio whose best lineup finished 10th. That points to entry count shaping the total: with few lineups, one strong score moves the average a long way.
The lesson
One lineup won. The rest of the process shows in the other 16, which supplied +22.01 of the edge. The biggest overweight, 82.4% against 23.3%, moved more points than any fade. Next week, check where your exposure sits above the field before you check where it sits below.
The edge spectrum: top gainers vs top detractors
Edge = (Exposure% - Field%)/100 × (FPTS - 13.79). Positive edge denotes points gained per lineup vs the field; negative edge denotes points surrendered.
Highest and lowest edge plays for CMACXIMUS. Field own = share of all 158,904 lineups. Winner exp = share of 17 lineups.
| Player | Pos | Team | Salary | Field own | Winner exp | Leverage | FPTS | Net edge | In win lineup? |
|---|---|---|---|---|---|---|---|---|---|
| Kenneth Walker III | RB | KC | $8,500 | 23.3% | 82.4% | +59.1% | 30.90 | +10.11 | Yes |
| Malik Nabers | WR | NYG | $6,500 | 24.0% | 52.9% | +28.9% | 31.50 | +5.12 | Yes |
| Germie Bernard | WR | PIT | $4,000 | 21.2% | 52.9% | +31.8% | 25.70 | +3.79 | Yes |
| Michael Penix Jr. | QB | ATL | $5,000 | 4.9% | 35.3% | +30.4% | 24.10 | +3.14 | Yes |
| Isaiah Likely | TE | NYG | $4,800 | 35.1% | 64.7% | +29.6% | 23.90 | +2.99 | Yes |
| Jalen Royals | WR | KC | $3,300 | 2.1% | 52.9% | +50.8% | 4.40 | -4.77 | No |
| Cody White | WR | LV | $3,200 | 1.8% | 17.7% | +15.9% | 0.00 | -2.19 | No |
| Jameis Winston | QB | NYG | $5,100 | 10.0% | 41.2% | +31.2% | 8.48 | -1.66 | No |
| Cyrus Allen | WR | KC | $3,500 | 1.2% | 17.7% | +16.5% | 4.70 | -1.49 | No |
| Patriots | DST | NE | $3,500 | 5.1% | 17.7% | +12.6% | 6.00 | -0.98 | No |
Stack architecture & QB distribution
The portfolio stacked 14 of 17 lineups (82.4%) across 5 distinct QB franchises.
Distribution of stack configurations and non-DST opponent bring-backs across all 17 lineups.
| Stack configuration | Lineups | Share | Mean score | Description |
|---|---|---|---|---|
| QB + 1 (Single Stack) | 6 | 35.3% | 144.51 | QB with 1 teammate |
| QB + 2 (Double Stack) | 5 | 29.4% | 164.96 | QB with 2 teammates |
| QB + 3 (Triple Stack) | 3 | 17.6% | 136.13 | QB with 3 teammates |
| Naked QB | 3 | 17.6% | 156.69 | QB with no teammate (the winning lineup) |
| Bring-Back (Game Stack) | 4 | 23.5% | 170.78 | Adds an opponent from the QB's game (not a DST) |
Top QB franchise allocations
Volume was dispersed across 5 teams with no franchise exceeding 35.3% of the portfolio.
Lineups per QB team, the most-used QB, the 2 most-used teammates, and the share of lineups with a bring-back.
| Team | Lineups | Exp % | Primary QB | Top stack teammates | Bring-back % |
|---|---|---|---|---|---|
| NYG | 7 | 41.2% | Jameis Winston (7) | Isaiah Likely (5), Malik Nabers (4) | 0.0% |
| ATL | 6 | 35.3% | Michael Penix Jr. (6) | Drake London (3), Bijan Robinson (2) | 66.7% |
| LAR | 2 | 11.8% | Matthew Stafford (2) | Kyren Williams (2), Puka Nacua (2) | 0.0% |
| CAR | 1 | 5.9% | Bryce Young (1) | Chuba Hubbard (1), Tetairoa McMillan (1) | 0.0% |
| KC | 1 | 5.9% | Patrick Mahomes (1) | Kenneth Walker III (1), Jalen Royals (1) | 0.0% |
Roster exposure & distribution tiers
The winner rostered 31 unique players across 17 lineups (13.4% of the 232 players used by the field).
Roster concentration by exposure tier.
| Exposure tier | Players | Roster spots | % of spots | Roster archetype & notable plays |
|---|---|---|---|---|
| Anchor Core (30%+) | 12 | 107 | 69.9% | Puka Nacua (58.8%), Isaiah Likely (64.7%), Kenneth Walker III (82.4%), Chiefs (70.6%), Malik Nabers (52.9%), Germie Bernard (52.9%), Jalen Royals (52.9%), Michael Mayer (47.1%), Jameis Winston (41.2%), Kyren Williams (35.3%), D'Andre Swift (35.3%), Michael Penix Jr. (35.3%) |
| Secondary (20–30%) | 3 | 12 | 7.8% | Drake London, Davante Adams, Tetairoa McMillan |
| Rotational Plays (10–20%) | 11 | 29 | 19.0% | Bijan Robinson, Xavier Worthy, Chuba Hubbard, Patriots (+7 more) |
| Sprinkles (5–10%) | 5 | 5 | 3.3% | Jalen Coker, Bryce Young, Kendrick Bourne (+2 more) |
The winning lineup
210.50 points with $50,000 in salary. Stack: QB + 0 ATL + 1 bring-back.
Field own = share of all 158,904 lineups. Winner exp. = share of the winning portfolio's 17 lineups.
| Slot | Player | Team | Salary | Field own | Winner exp. | Pts |
|---|---|---|---|---|---|---|
| QB | Michael Penix Jr. | ATL | $5,000 | 4.9% | 35.3% | 24.10 |
| RB | D'Andre Swift | CHI | $6,700 | 10.1% | 35.3% | 23.00 |
| RB | Chuba Hubbard | CAR | $6,300 | 18.2% | 17.7% | 22.10 |
| WR | Malik Nabers | NYG | $6,500 | 24.0% | 52.9% | 31.50 |
| WR | Xavier Worthy | KC | $4,600 | 21.3% | 17.7% | 14.30 |
| WR | Germie Bernard | PIT | $4,000 | 21.2% | 52.9% | 25.70 |
| TE | Isaiah Likely | NYG | $4,800 | 35.1% | 64.7% | 23.90 |
| FLEX | Kenneth Walker III | KC | $8,500 | 23.3% | 82.4% | 30.90 |
| DST | Chiefs | KC | $3,600 | 5.9% | 70.6% | 15.00 |
The top 10 portfolios
Each user in the first 10 rows of the standings, by best rank. Numbers only.
Edge total = points per lineup gained against the field. Mean chalk exp. = average exposure to Puka Nacua, Isaiah Likely and Panthers, 0% counted.
| Best rank | Entries | Players used | Edge total | Mean chalk exp. |
|---|---|---|---|---|
| 1st | 17 | 31 | +27.09 | 41.2% |
| 2nd | 3 | 20 | +26.19 | 33.3% |
| 3rd | 150 | 64 | +3.77 | 11.8% |
| 4th | 150 | 87 | +26.86 | 19.8% |
| 5th | 4 | 21 | +36.48 | 33.3% |
| 6th | 13 | 42 | +27.07 | 38.5% |
| 7th | 2 | 16 | +50.74 | 33.3% |
| 8th | 150 | 69 | +7.93 | 40.4% |
| 9th | 3 | 21 | +42.30 | 33.3% |
| 10th | 4 | 17 | +52.47 | 33.3% |
Open the tape
Every lineup of the winning portfolio, each player's exposure and edge against the field, and the rest of the top 10 are in Contest Analysis.
Reproduce it
The core facts come from two calls: the standings (the field block: pool size, the players the field used, the field's average lineup, the chalk) and the winner's lineups (players used, exposure, edge and the edge total). The winning lineup table comes from the contest download, and the top-10 table from each top-10 user's lineups. Every call is listed under Receipts. The calls need a Pro API key.
const BASE = 'https://api.stat-api.com/api/v1/dfs/contests/37021366';
const headers = { Authorization: 'Bearer <YOUR_API_KEY>' }; // a Pro key

type Standings = { standings: Array<{ rank: number; username: string; points: number }> };
type UserLineups = {
  user: { entries: number; players_used: number; avg_points: number; edge_total: number };
  exposure: Array<{ name: string | null; lineups: number; exposure_pct: number; field_pct: number | null; edge: number | null }>;
};

const get = async <T>(path: string): Promise<T> => {
  const res = await fetch(`${BASE}${path}`, { headers });
  if (!res.ok) throw new Error(`${res.status} ${await res.text()}`);
  return (await res.json()) as T;
};

const top = await get<Standings>('/standings?limit=10');
const winner = top.standings[0].username;
const tape = await get<UserLineups>(`/users/${encodeURIComponent(winner)}/lineups`);
console.log(winner, tape.user.entries, tape.user.players_used, tape.user.edge_total);
for (const p of [...tape.exposure].sort((a, b) => (b.edge ?? 0) - (a.edge ?? 0)).slice(0, 3))
  console.log(p.name, p.lineups, p.exposure_pct, p.field_pct, p.edge);
Endpoints behind this post
GET /api/v1/dfs/contests/37021366/standings?limit=10The standings and the field block: pool size, the field's average lineup, the chalk (Pro)GET /api/v1/dfs/contests/37021366/users/CMACXIMUS/lineupsEvery lineup of one user, with players used, exposure and edge (Pro)GET /api/v1/dfs/contests/37021366/download?format=jsonEvery lineup of the contest and the player pool with field ownership (Pro)Built automatically from the contest data. Every number links to its API call.
GET https://api.stat-api.com/api/v1/dfs/slates/seasons?sport=nfl2026-10-19T11:40:02ZGET https://api.stat-api.com/api/v1/nfl/context?season=2026&week=62026-10-19T11:40:02ZGET https://api.stat-api.com/api/v1/dfs/contests/37021366/download?format=json&enrich=dfs.player_stats2026-10-19T11:40:03ZGET https://api.stat-api.com/api/v1/dfs/slates/6765512026-10-19T11:40:03ZGET https://api.stat-api.com/api/v1/dfs/slate_settings/1302026-10-19T11:40:03ZGET https://api.stat-api.com/api/v1/dfs/contests/37021366/standings?limit=102026-10-19T11:40:03ZGET https://api.stat-api.com/api/v1/dfs/contests/37021366/users/CMACXIMUS/lineups2026-10-19T11:40:03ZGET https://api.stat-api.com/api/v1/dfs/contests/37021366/users/CodyJJohnson/lineups2026-10-19T11:40:03ZGET https://api.stat-api.com/api/v1/dfs/contests/37021366/users/Simplechef/lineups2026-10-19T11:40:03ZGET https://api.stat-api.com/api/v1/dfs/contests/37021366/users/weatherman172/lineups2026-10-19T11:40:03ZGET https://api.stat-api.com/api/v1/dfs/contests/37021366/users/skywalka2000/lineups2026-10-19T11:40:03ZGET https://api.stat-api.com/api/v1/dfs/contests/37021366/users/bpconsi/lineups2026-10-19T11:40:03ZGET https://api.stat-api.com/api/v1/dfs/contests/37021366/users/hagop/lineups2026-10-19T11:40:03ZGET https://api.stat-api.com/api/v1/dfs/contests/37021366/users/sliderss/lineups2026-10-19T11:40:03ZGET https://api.stat-api.com/api/v1/dfs/contests/37021366/users/jksb123/lineups2026-10-19T11:40:03ZGET https://api.stat-api.com/api/v1/dfs/contests/37021366/users/sithlords3000/lineups2026-10-19T11:40:03Z