Week 3: 10 lineups, 239.80 points, and Jahmyr Gibbs in 9 of 10 lineups
The winning portfolio in the $2.75M Millionaire stacked in 100.0% of its lineups and put its heaviest weight on a running back the field held at 26.8%.

- 10 lineups won the $2.75M Millionaire against 161,764 entries, with a top score of 239.80.
- Jahmyr Gibbs was in 9 of 10 lineups against a field at 26.8% and added +17.14 per lineup.
- The chalk split: under the field on Kenneth Walker III, over the field on Garrett Wilson.
- An edge total of +28.19 points per lineup gained against the field suggests an edge spread across the portfolio. The other lineups supplied +17.06 of it.
The result
The 180DegreesMiami portfolio won the $2.75M Millionaire on Sunday, Sep 27. Its top lineup scored 239.80 and beat 161,764 entries outright for $1,000,000. The portfolio entered 10 lineups at $20 each, cashed 6 of them and returned $1,000,310 in all. The lineups used 51 players, which is 18.5% of the 276 the field used.
One lineup won the contest. The portfolio's average lineup scored 156.68. The field's average lineup scored 128.47. The edge total, +28.19 points per lineup gained against the field, is close to that gap.
Pro view
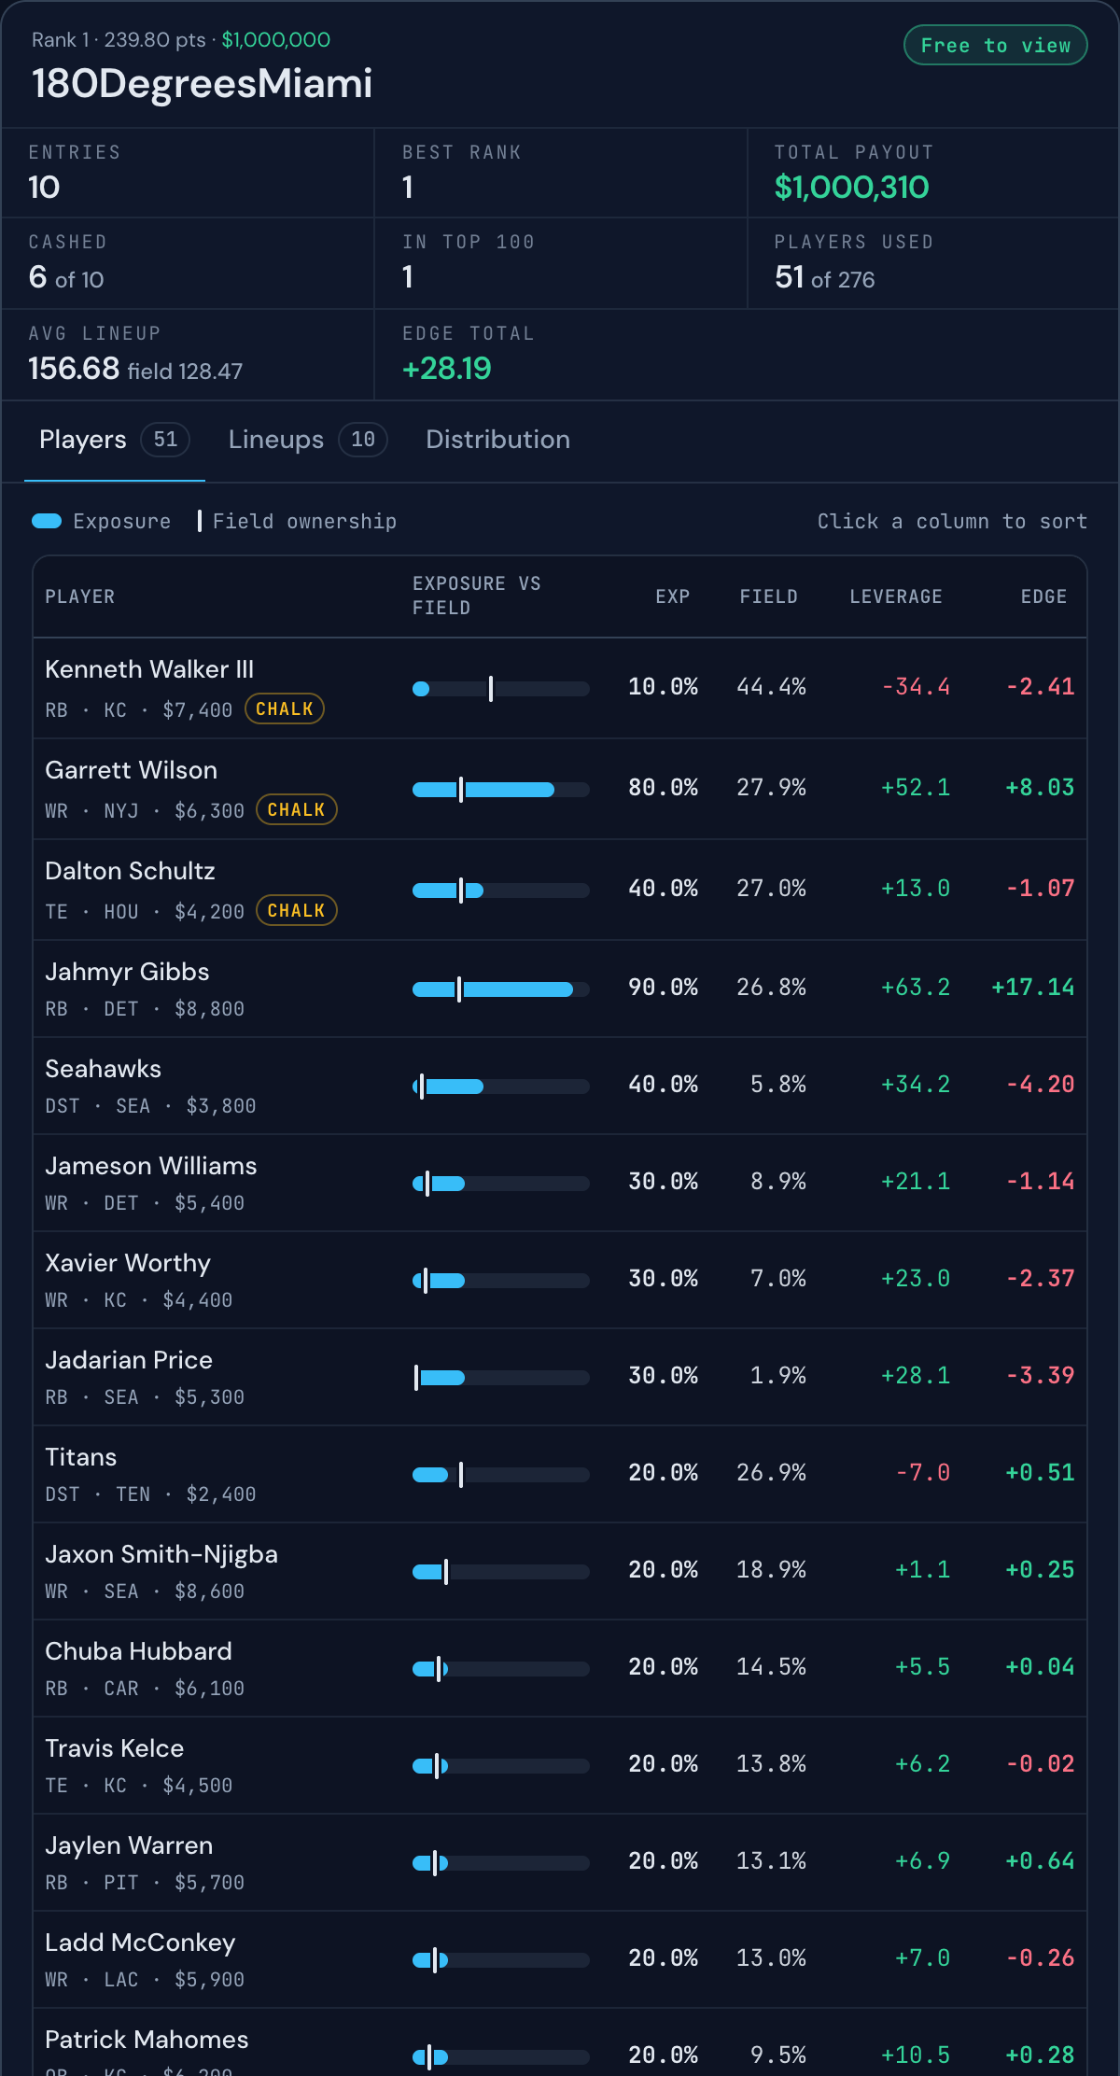
The chalk
Kenneth Walker III was the top chalk at 44.4%. The winning portfolio held him in 1 of 10 lineups, under the field. He scored 21.30, more than the field's average roster spot of 14.27, so the light weight cost -2.41 per lineup.
Garrett Wilson went the other way. The portfolio held him at 80.0% against a field at 27.9%, over the field. He scored 29.70 and returned +8.03 per lineup.
Dalton Schultz sat at 27.0% in the field and in 4 of 10 lineups here, also over the field. He scored 6.00, and that weight cost -1.07. The winning lineup held 1 chalk play.
The edge
Jahmyr Gibbs led the portfolio at +17.14 per lineup. He was in 9 of 10 lineups against a field at 26.8%. His 41.40 was the best score in the winning lineup.
He plays the same RB spot where Kenneth Walker III was the chalk. That points to a pivot. The lineups put their running back weight on a player the field held at 26.8%, not on the one it held at 44.4%.
Garrett Wilson came next at +8.03. After him came Kenyon Sadiq at +1.71, in 2 of 10 lineups against a field at 6.0%. Both play for NYJ, and both are in the winning lineup.
The biggest fade outside the chalk was Derrick Henry. He was in 0.0% of the lineups against 17.8% in the field. He scored 21.90, so leaving him out cost -1.36 per lineup.
The build
Every lineup was stacked: 10 of 10, across 9 different QB teams. The most-used, KC, appeared in only 20.0%. Bring-backs showed up in 90.0% of the lineups.
That reads like many stacks, with a bring-back in most lineups, not one game carrying the portfolio. The repeating came from a light core: Jahmyr Gibbs in 9 of 10 lineups and Garrett Wilson in 8 of 10 lineups.
The winning lineup ran QB + 2 NYJ + 2 bring-back: Geno Smith with Garrett Wilson and Kenyon Sadiq. The QB was in only 10.0% of the lineups. The lineup used $50,000 of the $50,000 cap and carried 121.8% total ownership.
Juwan Johnson, its lowest-owned seat at 5.9%, scored 24.30. The 9 other lineups averaged 147.45. They supplied +17.06 of the edge total, and the winning lineup supplied +11.13. That points to an edge spread across the portfolio, not one lucky ticket.
The rest of the top
The first 10 rows held 9 distinct portfolios. On Kenneth Walker III, 6 were under the field or out, and 1 had him in no lineup. On Garrett Wilson, 2 were under and 0 skipped him. On Dalton Schultz, 3 were under and 2 skipped him.
The highest edge total in the group, +94.11, belonged to a portfolio of 1 lineup at best rank 7th. The winning portfolio's edge total ranked 3rd, the upper half. It was the only portfolio of its size up there: 1 entered 10 lineups.
The counts suggest that Kenneth Walker III was the chalk most often held under the field at the top of the standings, and that Garrett Wilson mostly was not. These rows are a handful of outcomes out of 161,764 entries, and variance accounts for a large share of them.
The lesson
One lineup won, and the build does not prove a method. The lineups show exposure set player by player: under the field on Kenneth Walker III and over the field on Garrett Wilson. The largest gain, +17.14, came from a player the field held at 26.8%. That suggests the overweights did more work than the fades.
The overweights on Jahmyr Gibbs and Garrett Wilson returned +17.14 and +8.03. The biggest non-chalk fade cost -1.36. Next week, check where your exposure is above the field before you check where it is below.
The edge spectrum: top gainers vs top detractors
Edge = (Exposure% - Field%)/100 × (FPTS - 14.27). Positive edge denotes points gained per lineup vs the field; negative edge denotes points surrendered.
Highest and lowest edge plays for 180DegreesMiami. Field own = share of all 161,764 lineups. Winner exp = share of 10 lineups.
| Player | Pos | Team | Salary | Field own | Winner exp | Leverage | FPTS | Net edge | In win lineup? |
|---|---|---|---|---|---|---|---|---|---|
| Jahmyr Gibbs | RB | DET | $8,800 | 26.8% | 90.0% | +63.2% | 41.40 | +17.14 | Yes |
| Garrett Wilson | WR | NYJ | $6,300 | 27.9% | 80.0% | +52.1% | 29.70 | +8.03 | Yes |
| Kenyon Sadiq | TE | NYJ | $3,500 | 6.0% | 20.0% | +14.0% | 26.50 | +1.71 | Yes |
| George Kittle | TE | SF | $4,800 | 7.7% | 20.0% | +12.3% | 26.20 | +1.46 | No |
| Sam Darnold | QB | SEA | $5,400 | 2.3% | 10.0% | +7.8% | 32.66 | +1.42 | No |
| Seahawks | DST | SEA | $3,800 | 5.8% | 40.0% | +34.2% | 2.00 | -4.20 | No |
| Jadarian Price | RB | SEA | $5,300 | 1.9% | 30.0% | +28.1% | 2.20 | -3.39 | No |
| Kenneth Walker III | RB | KC | $7,400 | 44.4% | 10.0% | -34.4% | 21.30 | -2.41 | No |
| Xavier Worthy | WR | KC | $4,400 | 7.0% | 30.0% | +23.0% | 4.00 | -2.37 | No |
| Isaiah Williams | WR | NYJ | $3,300 | 6.9% | 20.0% | +13.1% | 3.10 | -1.46 | No |
Stack architecture & QB distribution
The portfolio stacked 10 of 10 lineups (100.0%) across 9 distinct QB franchises.
Distribution of stack configurations and non-DST opponent bring-backs across all 10 lineups.
| Stack configuration | Lineups | Share | Mean score | Description |
|---|---|---|---|---|
| QB + 1 (Single Stack) | 3 | 30.0% | 139.63 | QB with 1 teammate |
| QB + 2 (Double Stack) | 6 | 60.0% | 171.21 | QB with 2 teammates (the winning lineup) |
| QB + 3 (Triple Stack) | 1 | 10.0% | 120.66 | QB with 3 teammates |
| Bring-Back (Game Stack) | 9 | 90.0% | 151.82 | Adds an opponent from the QB's game (not a DST) |
Top QB franchise allocations
Volume was dispersed across 9 teams with no franchise exceeding 20.0% of the portfolio.
Lineups per QB team, the most-used QB, the 2 most-used teammates, and the share of lineups with a bring-back.
| Team | Lineups | Exp % | Primary QB | Top stack teammates | Bring-back % |
|---|---|---|---|---|---|
| KC | 2 | 20.0% | Patrick Mahomes (2) | Xavier Worthy (2), Travis Kelce (2) | 100.0% |
| BUF | 1 | 10.0% | Josh Allen (1) | Dalton Kincaid (1) | 100.0% |
| CIN | 1 | 10.0% | Joe Burrow (1) | Ja'Marr Chase (1), Tee Higgins (1) | 100.0% |
| DET | 1 | 10.0% | Jared Goff (1) | Amon-Ra St. Brown (1), Jameson Williams (1) | 100.0% |
| LAC | 1 | 10.0% | Justin Herbert (1) | Ladd McConkey (1), Quentin Johnston (1) | 100.0% |
| Other (4 Teams) | 4 | 40.0% | 4 distinct QBs | — | 75.0% |
Roster exposure & distribution tiers
The winner rostered 51 unique players across 10 lineups (18.5% of the 276 players used by the field).
Roster concentration across 5 exposure tiers.
| Exposure tier | Players | Roster spots | % of spots | Roster archetype & notable plays |
|---|---|---|---|---|
| Anchor Core (30%+) | 7 | 34 | 37.8% | Garrett Wilson (80.0%), Dalton Schultz (40.0%), Jahmyr Gibbs (90.0%), Seahawks (40.0%), Jameson Williams (30.0%), Xavier Worthy (30.0%), Jadarian Price (30.0%) |
| Secondary (20–30%) | 12 | 24 | 26.7% | Titans, Jaxon Smith-Njigba, Chuba Hubbard, Travis Kelce (+8 more) |
| Rotational Plays (10–20%) | 32 | 32 | 35.6% | Kenneth Walker III, Parker Washington, Amon-Ra St. Brown, Dalton Kincaid (+28 more) |
The winning lineup
239.80 points with $0 of the $50,000 cap left. Stack: QB + 2 NYJ + 2 bring-back.
Field own = share of all 161,764 lineups. Winner exp. = share of the winning portfolio's 10 lineups.
| Slot | Player | Team | Salary | Field own | Winner exp. | Pts |
|---|---|---|---|---|---|---|
| QB | Geno Smith | NYJ | $4,900 | 7.5% | 10.0% | 30.04 |
| RB | Jahmyr Gibbs | DET | $8,800 | 26.8% | 90.0% | 41.40 |
| RB | Jaylen Warren | PIT | $5,700 | 13.1% | 20.0% | 23.60 |
| WR | Jaxon Smith-Njigba | SEA | $8,600 | 19.0% | 20.0% | 38.36 |
| WR | Garrett Wilson | NYJ | $6,300 | 27.9% | 80.0% | 29.70 |
| WR | Jameson Williams | DET | $5,400 | 8.9% | 30.0% | 8.90 |
| TE | Kenyon Sadiq | NYJ | $3,500 | 6.0% | 20.0% | 26.50 |
| FLEX | Juwan Johnson | NO | $3,700 | 5.9% | 20.0% | 24.30 |
| DST | Vikings | MIN | $3,100 | 6.6% | 10.0% | 17.00 |
The top 10 portfolios
Each user in the first 10 rows of the standings, by best rank. Numbers only.
Edge total = points per lineup gained against the field. Mean chalk exp. = average exposure to Kenneth Walker III, Garrett Wilson and Dalton Schultz, 0% counted.
| Best rank | Entries | Players used | Edge total | Mean chalk exp. |
|---|---|---|---|---|
| 1st | 10 | 51 | +28.19 | 43.3% |
| 2nd | 4 | 16 | +86.21 | 33.3% |
| 3rd | 150 | 119 | +17.18 | 37.1% |
| 4th | 150 | 91 | +23.07 | 34.2% |
| 5th | 150 | 126 | -4.21 | 28.0% |
| 5th | 150 | 108 | +18.34 | 49.6% |
| 7th | 1 | 9 | +94.11 | 66.7% |
| 9th | 150 | 83 | +9.69 | 23.6% |
| 10th | 5 | 32 | +24.29 | 33.3% |
Open the tape
Every lineup of the winning portfolio, each player's exposure and edge against the field, and the rest of the top 10 are in Contest Analysis.
Reproduce it
The core facts come from two calls: the standings (the field block: pool size, the players the field used, the field's average lineup, the chalk) and the winner's lineups (players used, exposure, edge and the edge total). The winning lineup table comes from the contest download, and the top-10 table from each top-10 user's lineups. Every call is listed under Receipts. The calls need a Pro API key.
const BASE = 'https://api.stat-api.com/api/v1/dfs/contests/14562638';
const headers = { Authorization: 'Bearer <YOUR_API_KEY>' }; // a Pro key

type Standings = { standings: Array<{ rank: number; username: string; points: number }> };
type UserLineups = {
  user: { entries: number; players_used: number; avg_points: number; edge_total: number };
  exposure: Array<{ name: string | null; lineups: number; exposure_pct: number; field_pct: number | null; edge: number | null }>;
};

const get = async <T>(path: string): Promise<T> => {
  const res = await fetch(`${BASE}${path}`, { headers });
  if (!res.ok) throw new Error(`${res.status} ${await res.text()}`);
  return (await res.json()) as T;
};

const top = await get<Standings>('/standings?limit=10');
const winner = top.standings[0].username;
const tape = await get<UserLineups>(`/users/${encodeURIComponent(winner)}/lineups`);
console.log(winner, tape.user.entries, tape.user.players_used, tape.user.edge_total);
for (const p of [...tape.exposure].sort((a, b) => (b.edge ?? 0) - (a.edge ?? 0)).slice(0, 3))
  console.log(p.name, p.lineups, p.exposure_pct, p.field_pct, p.edge);
Endpoints behind this post
GET /api/v1/dfs/contests/14562638/standings?limit=10The standings and the field block: pool size, the field's average lineup, the chalk (Pro)GET /api/v1/dfs/contests/14562638/users/180DegreesMiami/lineupsEvery lineup of one user, with players used, exposure and edge (Pro)GET /api/v1/dfs/contests/14562638/download?format=jsonEvery lineup of the contest and the player pool with field ownership (Pro)Built automatically from the contest data. Every number links to its API call.
GET https://api.stat-api.com/api/v1/dfs/slates/seasons?sport=nfl2026-09-28T15:06:31ZGET https://api.stat-api.com/api/v1/dfs/slates?operator_id=1&date=2026-09-272026-09-28T15:06:31ZGET https://api.stat-api.com/api/v1/dfs/contests?slate_id=3630052026-09-28T15:06:32ZGET https://api.stat-api.com/api/v1/dfs/contests/14562638/download?format=json&enrich=dfs.player_stats2026-09-28T15:06:34ZGET https://api.stat-api.com/api/v1/dfs/slates/3630052026-09-28T15:06:34ZGET https://api.stat-api.com/api/v1/dfs/slate_settings/1302026-09-28T15:06:34ZGET https://api.stat-api.com/api/v1/dfs/contests/14562638/standings?limit=102026-09-28T15:06:34ZGET https://api.stat-api.com/api/v1/dfs/contests/14562638/users/180DegreesMiami/lineups2026-09-28T15:06:34ZGET https://api.stat-api.com/api/v1/dfs/contests/14562638/users/eafern/lineups2026-09-28T15:06:34ZGET https://api.stat-api.com/api/v1/dfs/contests/14562638/users/hishboo/lineups2026-09-28T15:06:34ZGET https://api.stat-api.com/api/v1/dfs/contests/14562638/users/adam2761/lineups2026-09-28T15:06:34ZGET https://api.stat-api.com/api/v1/dfs/contests/14562638/users/Dpac2/lineups2026-09-28T15:06:34ZGET https://api.stat-api.com/api/v1/dfs/contests/14562638/users/monkeyhuesser/lineups2026-09-28T15:06:34ZGET https://api.stat-api.com/api/v1/dfs/contests/14562638/users/bkuhse/lineups2026-09-28T15:06:35ZGET https://api.stat-api.com/api/v1/dfs/contests/14562638/users/matgic11/lineups2026-09-28T15:06:35ZGET https://api.stat-api.com/api/v1/dfs/contests/14562638/users/wlw67/lineups2026-09-28T15:06:35Z